Researchers from the Commonwealth Fund found that Americans visit physicians less often than citizens in other high-income countries and have one of the lowest ratios of practicing physicians and hospital beds per 1,000 people. Yet, the US spends 3-4 times more on healthcare than Japan, New Zealand, and South Korea.
Further, the US spends almost 18% of its GDP covering healthcare costs, yet its citizens are less healthy than those in peer countries. Strangely, the US spent 17.8% of its GDP on healthcare in 2021, nearly double the average spend of OECD countries, yet does not guarantee health coverage as other high-income countries.
 What does this mean, and how does this affect physicians? This article examines the economic pressures influencing health spending and how it impacts physicians. It also provides valuable strategies physicians can implement to combat the adverse effects of these healthcare spending trends.
Health spending growth
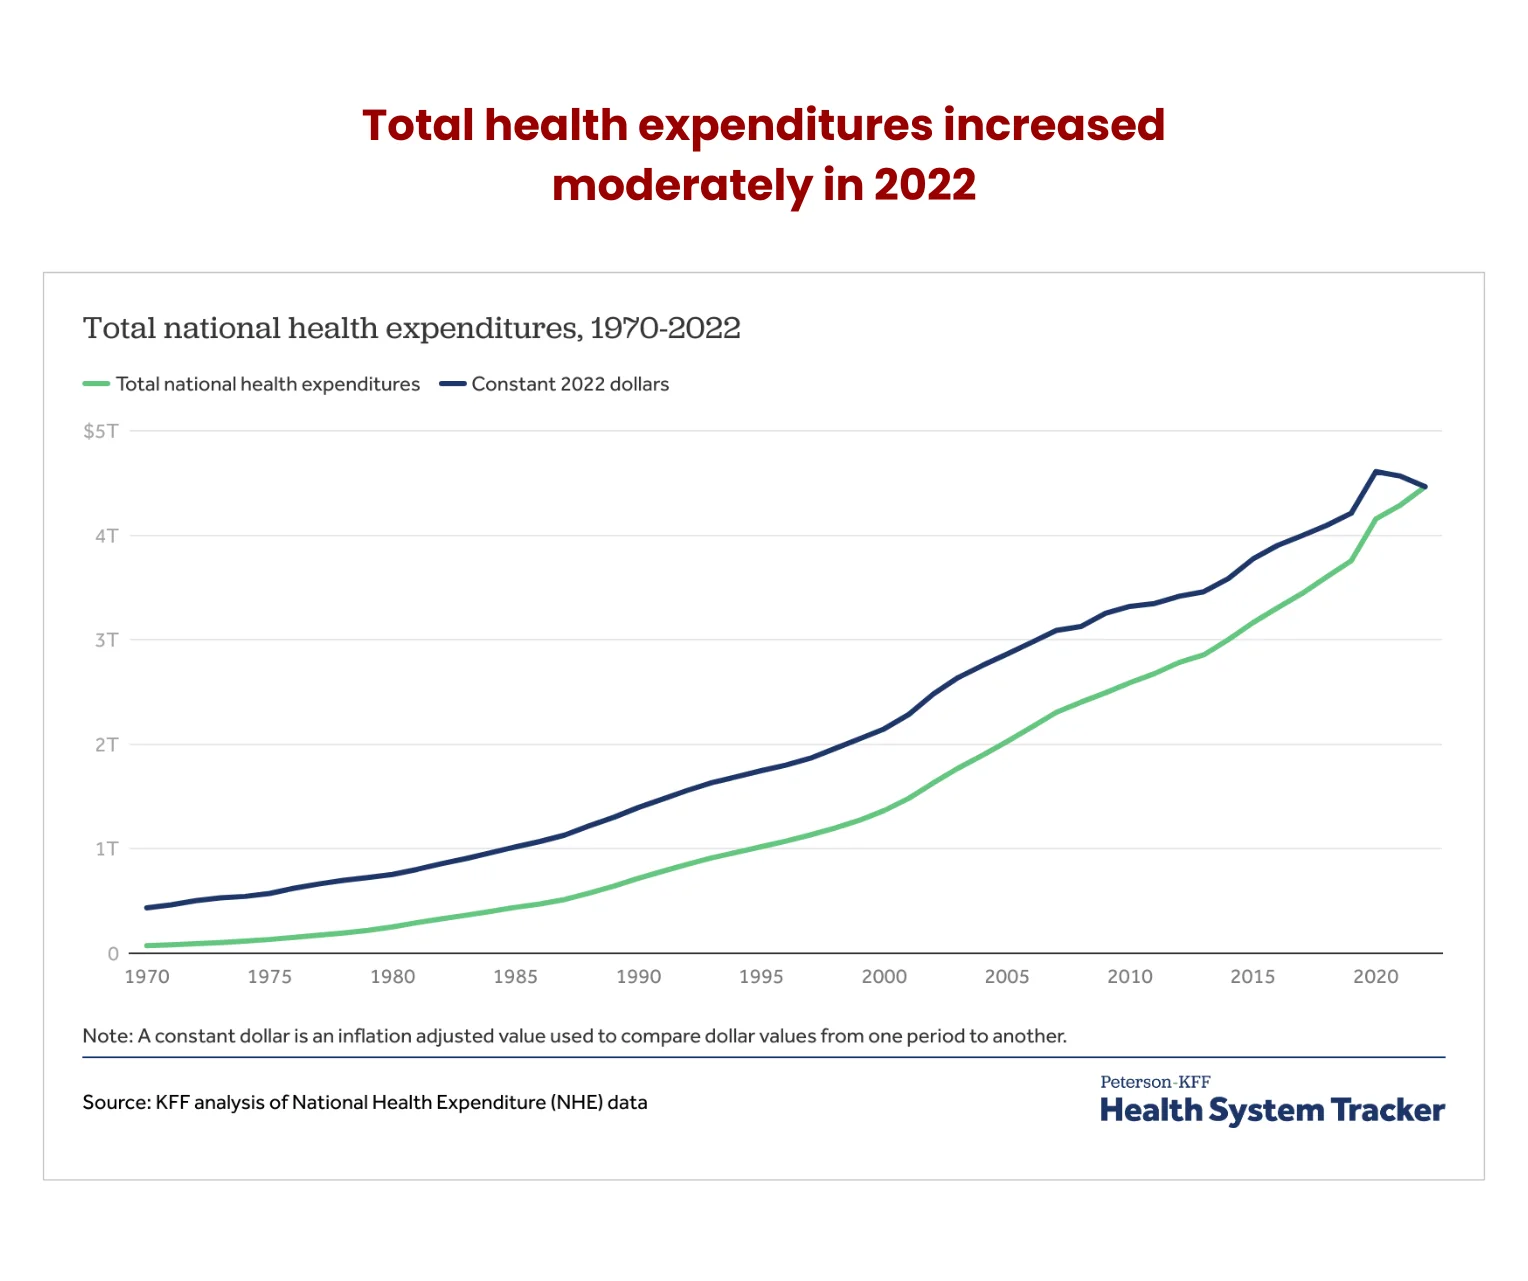
According to the latest national health expenditure (NHE) data, health spending topped $4.5 trillion in 2022, a 4.1% growth from 2021. This represents the total cash spent on health care and its related activities like research and administration.
The data also shows that the economy-wide inflation rate was higher than that affecting the health sector in 2022. Adjusted for inflation affecting the rest of the economy, health spending reduced -2.2% year-over-year (YoY).
However, the NHE deflator compilation data asserts that the real NHE grew by 0.9% during the period. The deflator takes into account the aggregate of consumer and producer price indices for services and commodities.
Overall spending on health in 2022 increased by $175 billion from 2021. Spending on health rose across most categories except federal and state public health, which decreased by $2 billion. The top three categories that registered the highest spending were prescription drugs, hospital expenses, administration costs, and physicians and clinics.
Federal spending on public health
The biggest victim of the pandemic-era spending cuts was federal health spending, which dropped in consecutive years. The data shows it fell from $101 billion in 2021 to $92 billion in 2022 (a 9% dip) on the back of expired federal policies supporting COVID-19 eradication.
This lower spend is still higher than in the pre-pandemic era, so there could be more federal budgetary cuts in the future. Conversely, local and state public spending rose by 6.3% over the same period.
Per person health spending
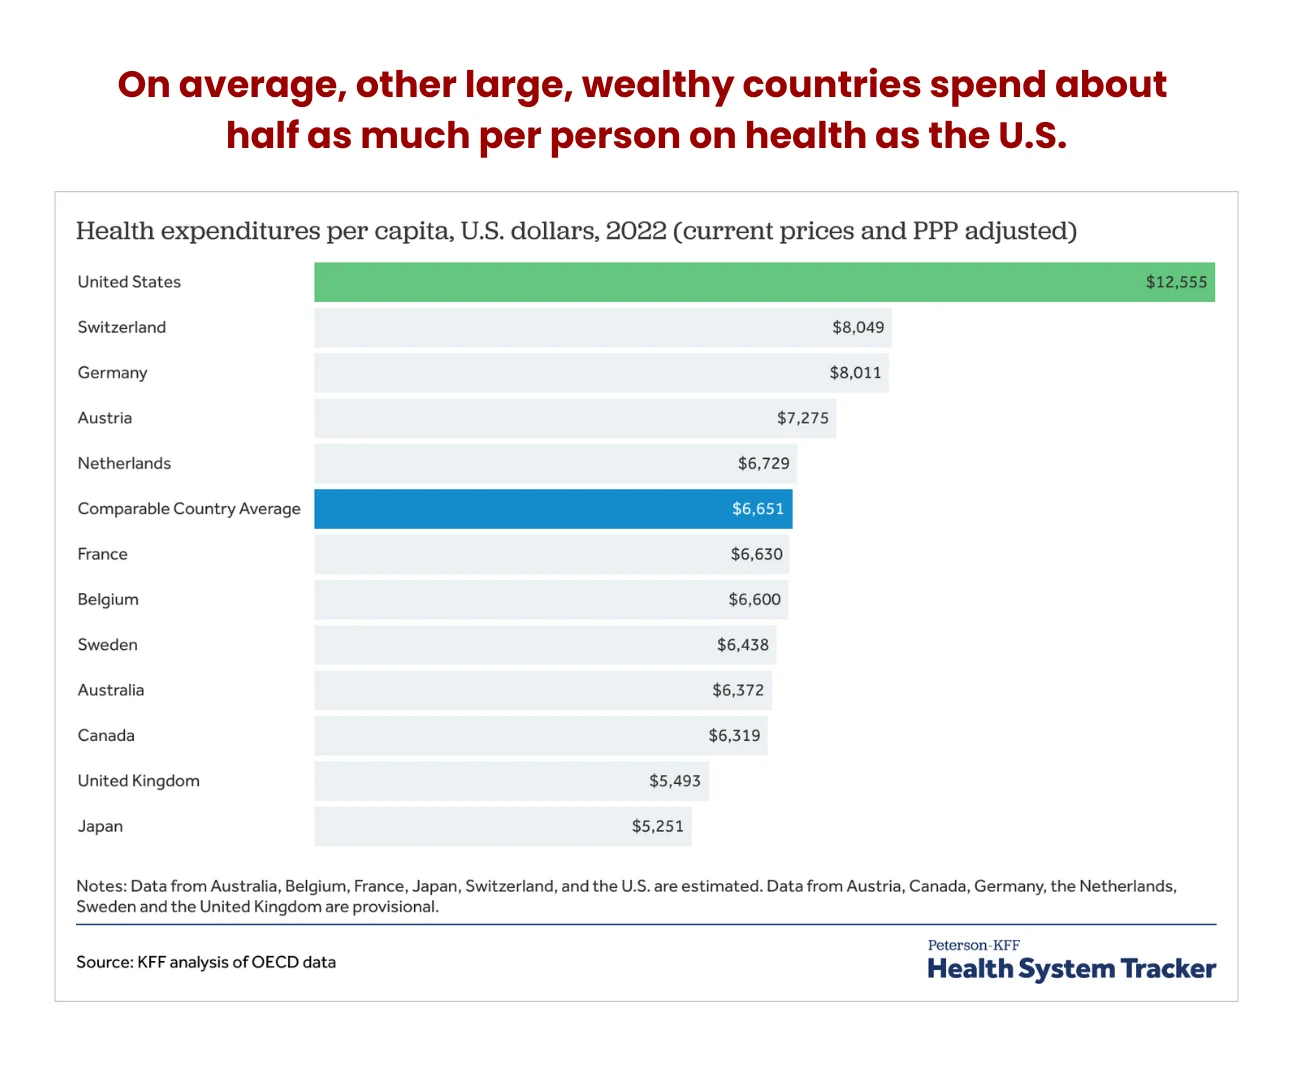
Research reveals that the US spends nearly twice as much on health per person as its peers. The average per person spend was $13,493 in 2022, with rising medical services prices the primary catalyst for the upward trajectory.
For example, Medicaid spending reached $805.7 billion in 2022. This 9.6% growth over the previous year represents an 18% chunk of the total NHE. Similarly, Medicare expenses were $944.3 billion, a 5.9% growth YoY, accounting for 21% of the NHE.
Private health insurance spending also rose 5.9%, costing $1.28 trillion, accounting for 29% of the NHE.
What is fueling the high cost?
Americans are paying more for similar services as citizens in 12 comparative countries in the OECD are receiving, paying as much as 15% more in some instances.
1. Administrative costs
Administrative costs have ballooned into the largest component of excess spending, representing the biggest catalyst of healthcare expenditure growth. US citizens are paying about 30% more in NHE administrative costs. For instance, hospital care expenses rose 2.2% to $1.4 trillion in 2022.
Further, the number of administrators has grown disproportionally compared to healthcare workers. According to data from the Physicians for a National Health Program using data from the BLS, the number of physicians grew 200% between 1970 and 2019 compared to a 3,800% rise in administrators during the same period.
While the physician growth rate is in line with the population growth, the lopsided increase in administrators has led to the current situation where there are 10 hospital administrators for every physician.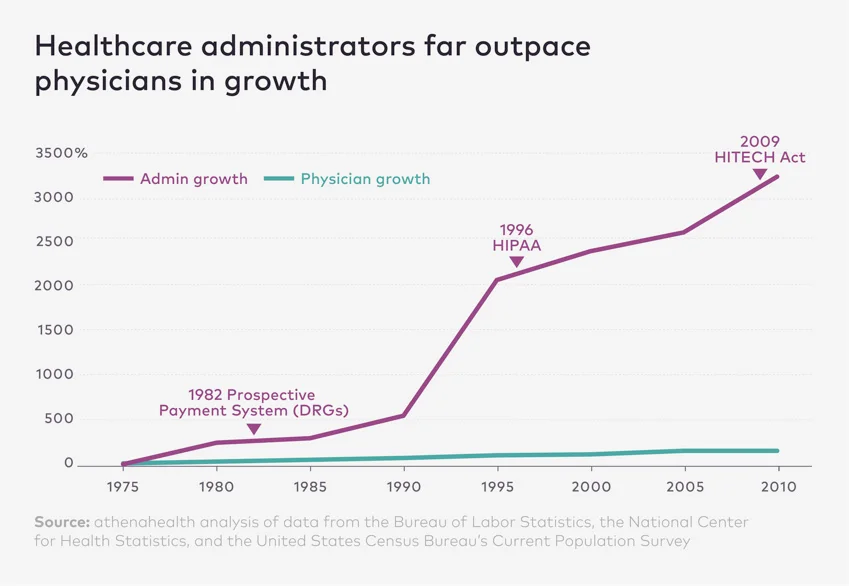 And hospital bills on a per-person basis have followed the same trajectory, rising 3,100%. Healthcare costs were $353 in 1970 compared to $11,453 in 2019, adjusted for inflation.
Americans spend about 15% more on health insurance-related costs like rework, eligibility, submission, and coding. Additionally, they pay 15% more for human resources, general administration, accreditation, and quality reporting.
2. Nurses
American registered nurses make about 1.5 times their peers, translating to about 15% more than in comparative countries.
Travel nurses’ compensation has skyrocketed, with some out-earning physicians. While the median pay for registered nurses is $86,070 annually, travel nurses make $109,564 on average, up to a maximum of $543,048. This is higher than in pediatrics, geriatrics, occupational medicine, and preventive medicine.
The Commonwealth Fund pegs this down to higher educational debt and the context of the American labor market.
3. Prescription drugs
The US spends about double on retail prescription drugs per person than comparable jurisdictions. Further, retail prescriptions range between 2-3 times more expensive than similar offerings in peer countries in the OECD.
Branded drugs cost more and account for about 80% of retail prescription drug purchases. Generic drug prices are almost at par with comparable countries.
The start of every year usually triggers a run of price increases, and 2024 was no different. Research by 46Brooklyn Research reveals there’ve been 962 price hikes on all drugs by the end of March 2024, affecting 72% of all Medicaid brand name drug spend.
After the price changes, the cost per claim of brand-name drugs before the Medicaid rebate has risen to an all-time high of $1,348, up from $1,329 in 2023.
The reason prices are going up is because of rebates, which have been rising as well. Manufacturers’ take-home is shrinking as the average rebate is about 52%. Some medicine makers receive as little as $0.48 on the dollar.
Some manufacturers have been forced to reduce their list prices under the threat of severe penalties imposed by the American Rescue Plan Act. List prices for drugs like inhalers and insulin have dropped by 70%-80%. So, medicine manufacturers are raising drug prices across the board to stay profitable.
4. Per capita out-of-pocket expenditures
The OECD reports that the US fares favorably against its member countries under this category, with American patients forking 11% of health expenditure from their pockets compared to the 18% average across the OECD in 2023.
However, the latest CMS NHE data for 2022 shows out-of-pocket (OOP) spending rose to $471.4 billion (6.6%) in 2022, accounting for 11% of total NHE. This works out to about $1,425 per capita on average, a slight decrease from $1,428 in 2021.
Some OOP expenses, like durable medical equipment, dental services, and physician and clinical services, decreased in 2022, accounting for 34% of the entire OOP expenses.
Note that out-of-pocket expenditure does not include contributions towards health insurance premiums.
Health spending growth vs GDP growth
As noted earlier, NHE spending in 2022 stood at $4.5 trillion, representing 17.3% of the gross domestic product (GDP). Juxtaposed against the consumer price index (CPI), medical care prices rose 3% by June 2023 over the same period in 2022, according to the Bureau of Labor Statistics (BLS).
However, inflation outpaced healthcare prices. This went against the established trend of the past two decades, where medical care prices generally climbed faster than inflation.
Notably, prices for all goods and services, less medical care, rose 3.2%. Primary residential rent experienced the highest growth at 8.3%, with food (5.7%) and electricity (5.4%) the next biggest movers. Gasoline (all types) experienced the largest drop (-26.5%). Core inflation (food and energy excluded) stood at 4.8%.
CPI measures the average change in the prices consumers pay for goods and services over a yearly period. Similarly, Medical care CPI considers changes in medical care prices, including OOP costs and what insurers pay pharmacies and providers.
The latest data shows the CPI for all urban consumers (CPI-U) rose by 0.4% between March and February 2024, while the unadjusted 12-month CPI-U for all items in the year ended March 2024 was 3.5%.
The annual unadjusted CPI-U for medical care commodities as of March 2024 was 2.5%, while medical care services CPI-U was 2.1% over the same period. Overall, the medical care index rose 2.2%.
Tracking health price growth
Physician services CPI for urban consumers grew by 0.5% but was outpaced by prescription drugs at 3.1% and nursing home services at 3.3%. Still, these could not match overall hospital services at 4.2%, with outpatient contributing 5.7% and inpatient chipping in with 3.7%.
If anything, physician’s inflation-adjusted income has been on a downward spiral for an extended period. A national study by the Center for Studying Health System Change reported that physician’s incomes were reduced by 7% between 1995 and 2003, while other professionals saw their incomes increase by 7% during the same period.
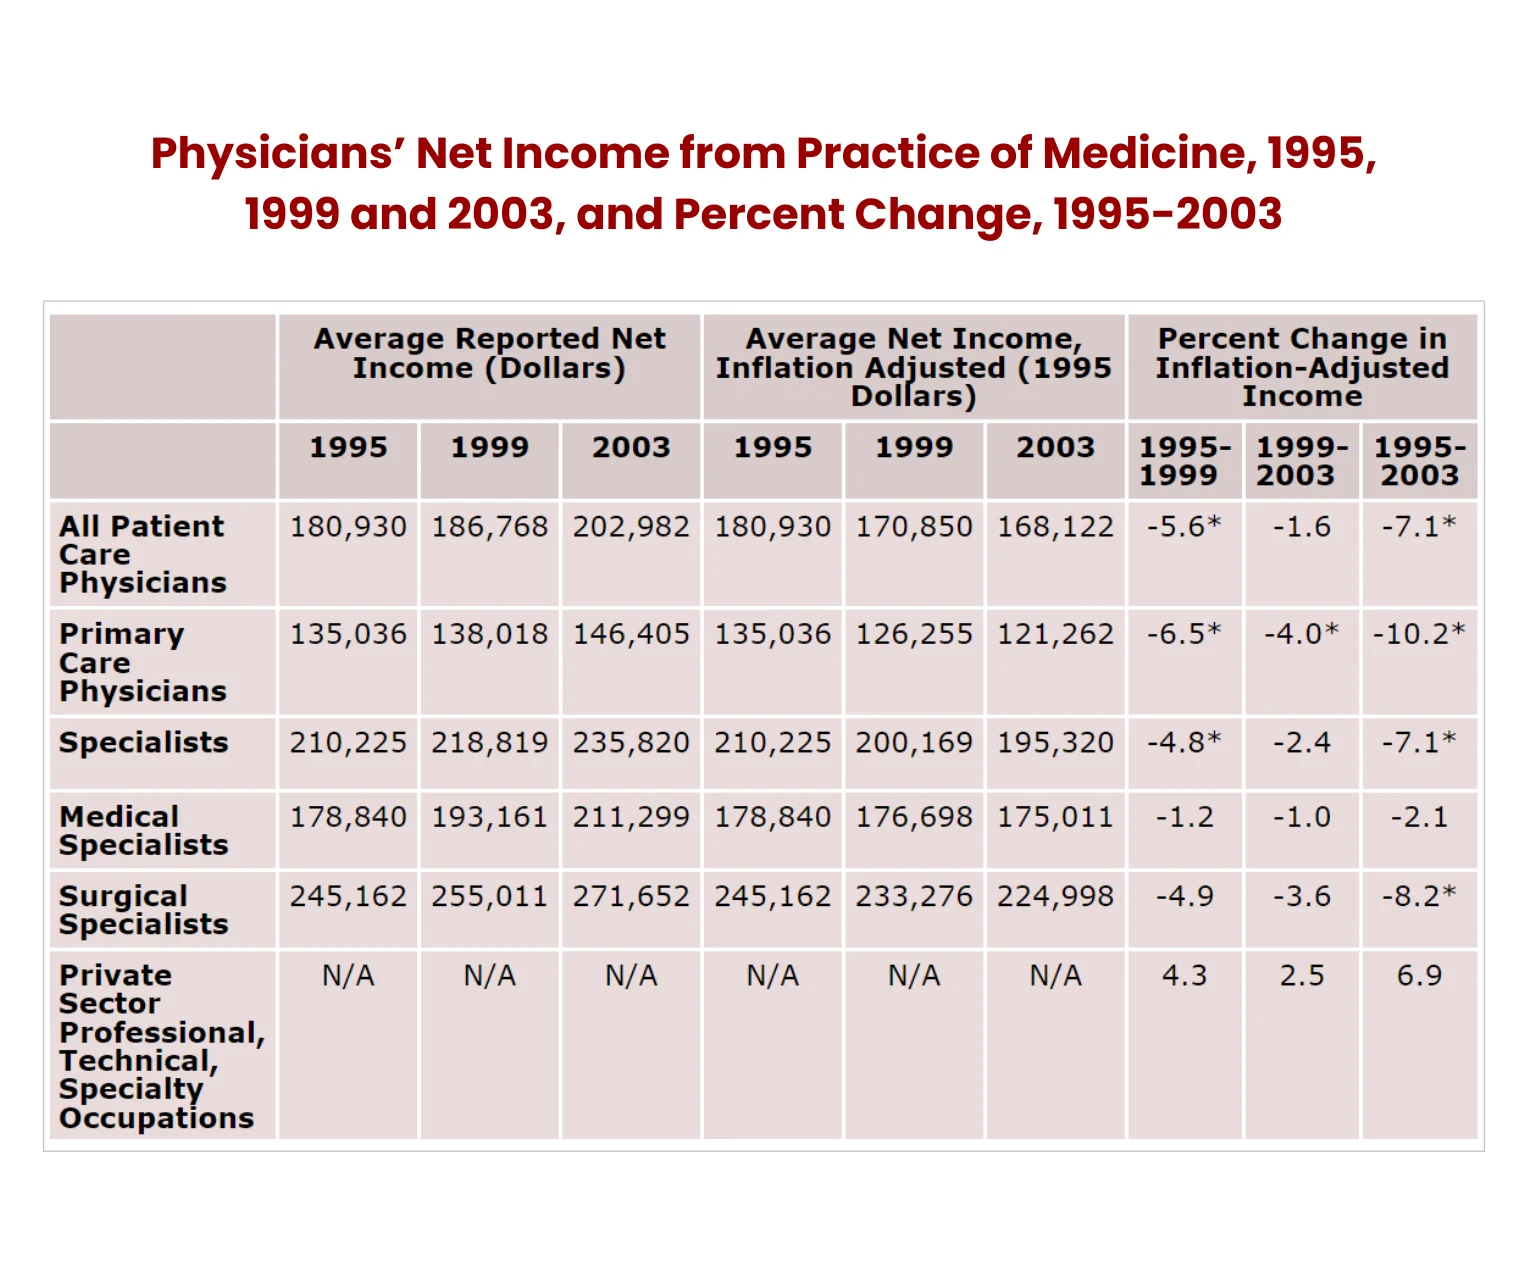
Notes: The Bureau of Labor Statistics (BLS) Employment Cost Index of wages and salaries for private sector “professional, technical and specialty” workers was used to calculate estimates for these workers. Significance tests are not available for these estimates. All inflation-adjusted estimates were calculated using the BLS online inflation calculator. The composition of the physician population changed between 1995 and 2003—a fact that makes some estimates of percentage changes in real income appear inconsistent (for example, estimates of income changes for all patient care physicians not falling between estimates for primary care physicians and specialists). These data patterns occur because the proportion of medical specialists steadily increased from 1995 to 2003 (32% to 38%) while the proportions of primary care physicians and surgical specialists both declined by about 3 percentage points.
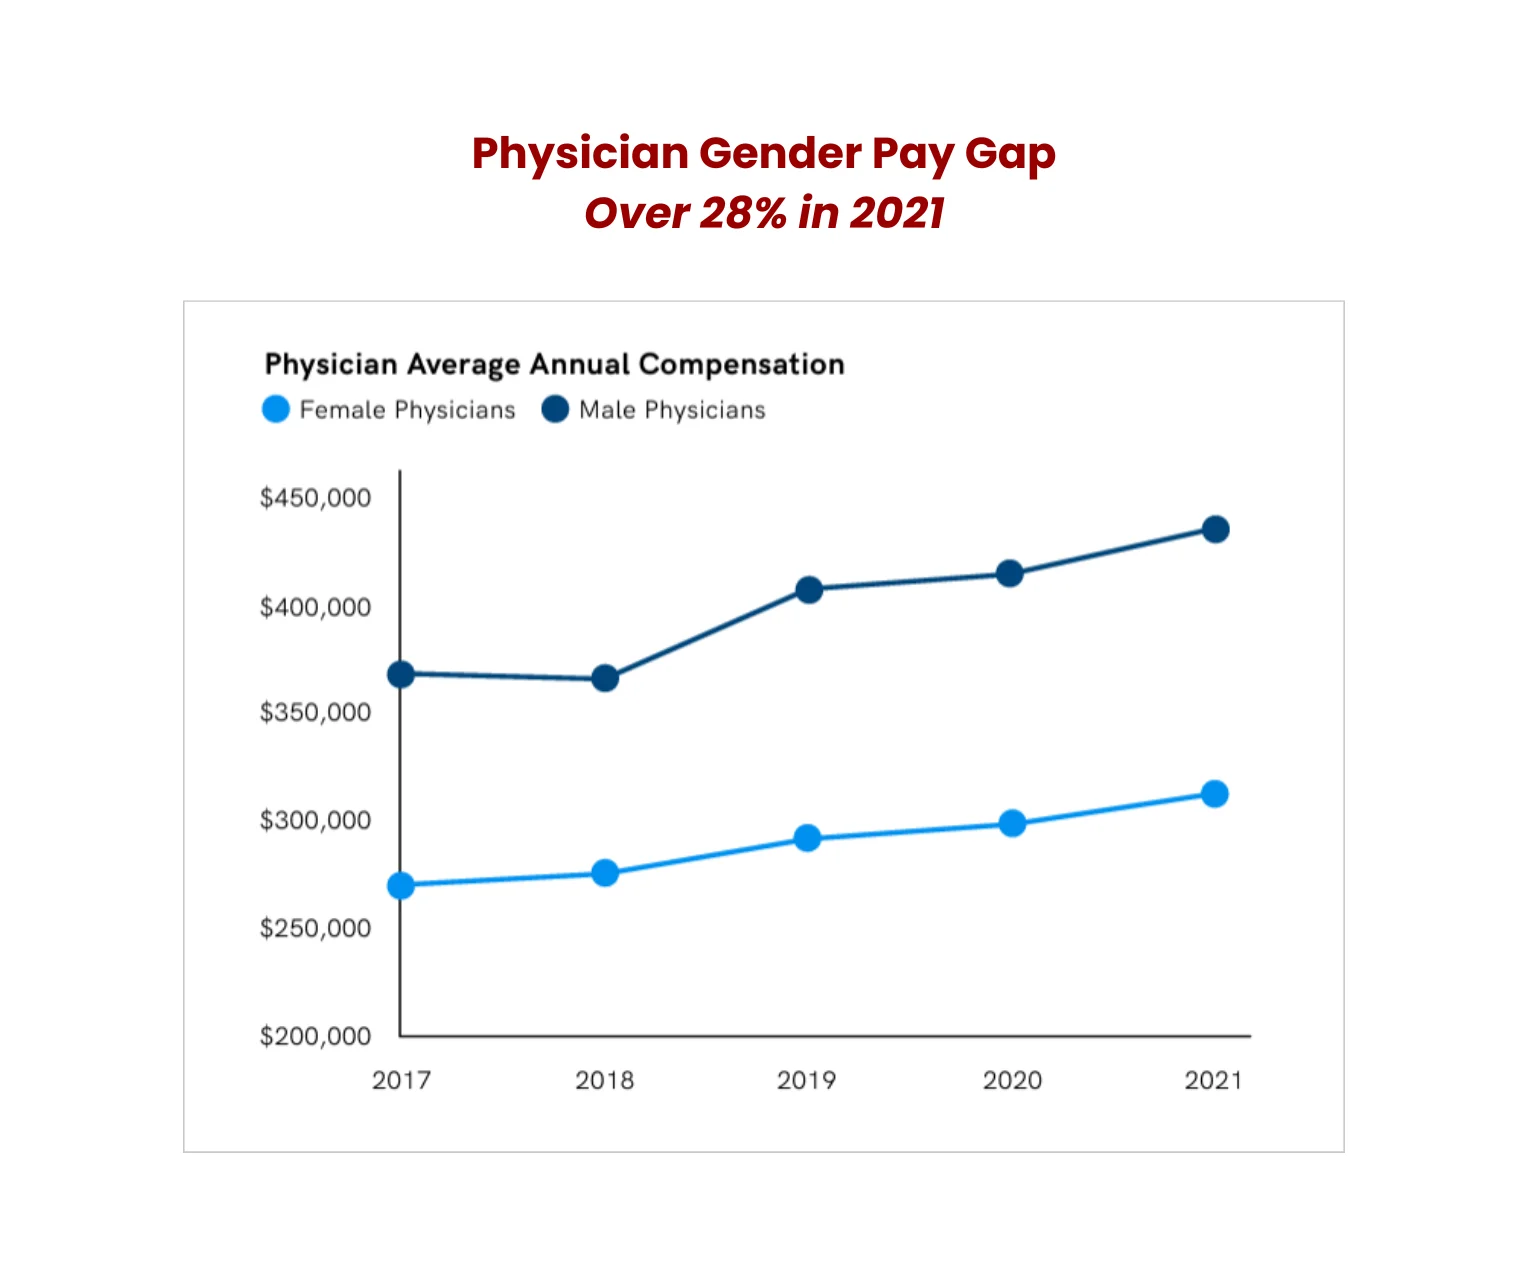
Further, a Doximity survey carried out between 2017 and 2021 shows although physicians’ compensation across all specializations increased during the period, the 3.15% inflation rate throughout that period meant only 53% of specialties experienced real compensation growth. However, the 7% inflation rate in 2021 wiped out any gains from wage increases.
 Health insurance CPI dipped from an all-time-high annual increase of 28.2% in September 2022 to -24.9% in June 2023. Overall, medical care prices realized the slowest decades-long price gain in June 2023.In 2024, BLS data shows the CPI-U for medical care services index went up by 0.6% in March, up from the -0.1% recorded in February. Medical care commodities were up 0.2% in March, higher than the 0.1% recorded the previous month, although this is not seasonally adjusted.
Urban care consumers experienced the best returns in medical care commodities in January as prices dropped by -0.6%. Physicians’ services index rose by 0.1%, hospitals by 1%, and prescription drugs increased by 0.3%.
Urban consumers’ CPI vs health services producer prices
Unlike the general trend for the past decade, urban consumers’ health services producer price index (PPI) rose faster than the CPI. The PPI measures the price change inflation in medical services by physicians and other providers paid by third parties like employers.
PPI considers the actual transaction prices when considering changes in output costs. From June 2009 to June 2023, medical services CPI rose 49.6%, while health care PPI has only achieved a 35.3% growth. This data does not consider medical equipment and prescription drugs PPI and CPI.
What this means for physicians
The growing cost of health spending can only mean medical care is becoming increasingly unaffordable. Patients must contend with medical inflation, rising OOP expenses, and a higher-than-expected consumer inflation rate.
A study found that 74% of Americans worried about their ability to pay off an emergency medical bill. Almost half of American adults surveyed said they couldn’t settle a $500 emergency bill without taking on debt.
Surprisingly, even those with medical insurance coverage or higher incomes are also feeling the pinch. 47% of insured adults say they are having difficulties affording health care costs compared to 85% for the uninsured. 21% of households with incomes over $90,000 reportedly struggle to afford their healthcare costs.
The steady increase in medical costs, especially OOP expenses, has diminished their ability to settle medical bills. For example, commercially insured patients used to be the rock-solid basis of providers’ payer mix, but this has changed drastically over the past few years.
In 2018, for instance, 11% of hospital’s bad debt came from self-pay insured accounts. That figure crept up to 58% by 2022.
Patients were encouraged to utilize OOP to offset rising copayment costs. Most decided to seek over-the-counter (OTC) treatments before visiting the physician. However, insurance premiums crept higher, leaving OTC as the only economically viable choice for patients keen on keeping premium costs low.
As employers delivered lower premiums to workers, this had the unintended consequence of increasing the medical cost burden on employees who needed more care than OTC could provide. This category of employers would be forced to take on co-insurance and higher deductibles.
Commercially insured patients took on more medical debt, which inevitably led to them opting out of essential medical care out of fear of incurring more debt.
What physicians can do to mitigate inflationary pressures
One way physicians can deal with thinning revenue is to stop providing financing in the first place. There are new financing models that take the pressure out of securing medical debts while safeguarding their pay.
These new medical plans safeguard patients from unusually high repayment plans while ensuring healthcare providers receive their full payments promptly. Moreover, the new approach also settles patients’ OOP costs.
Specialist medical payment providers streamline the payment process by paying providers upfront and assuming the long-term payment option with patients.
All this means physicians won’t have to follow up or hire additional staff and collection agencies to chase after bills.
Patients will also seek medical attention when they need it, not when their pocket allows it. This could lead to healthcare providers receiving a steady stream of patients, enhancing their revenues.
Final word
Americans are paying more for less, and physicians are paying the price. The unfavorable economic climate means fewer adults can afford medical care, so they avoid physician office visits even when necessary.
Physicians should adopt new financing models that shift credit risk to third parties who settle their bills upfront and have the expertise and resources to follow up on errant borrowers. This frees up more time for physicians to care for their patients.
To secure your financial future, enroll for our Real Estate Investing Course for Physicians.